How to Use Task Analytics
You can use Task Analytics to create flexible summary tables that help analyze large amounts of data.
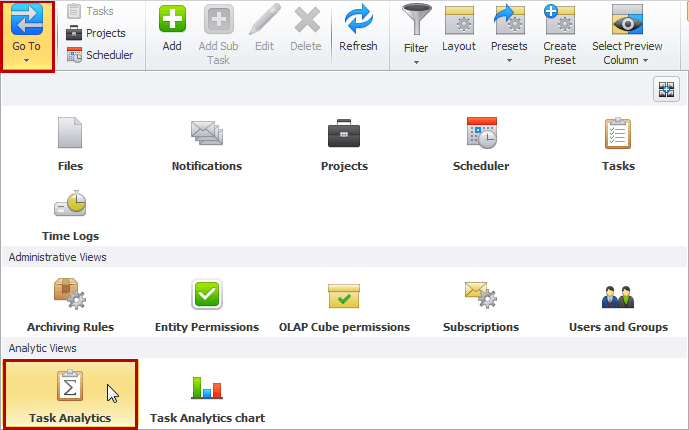
- To open the Task Analytics view, clickGo To, and then click Task Analytics.
Task Analytics view consists of the Pivot table and the Layout Settings pane. The fields added from the Fields list to the areas in the Layout Settings pane are then displayed in the corresponding areas in the Pivot table.
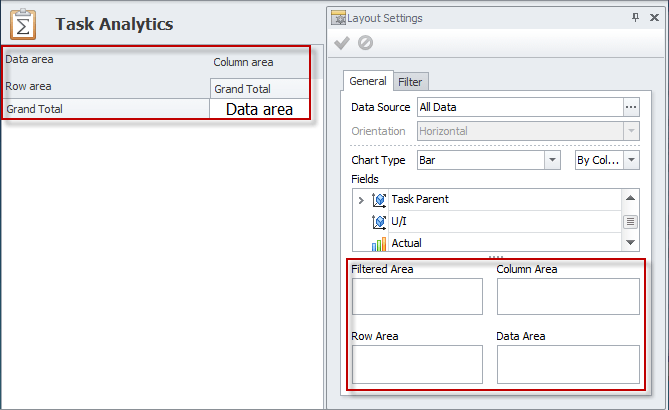
Note Filtered area in the Pivot table is hidden when Filtered Area in the Layout Settings pane is empty.
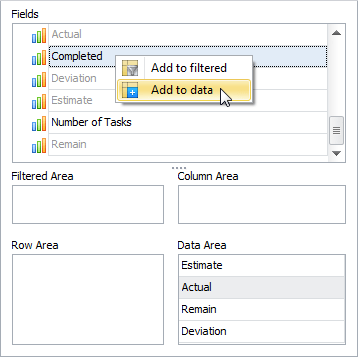
The majority of fields that are shown in the Fields list can be added to the Column Area, the Row Area, and the Filtered Area boxes.
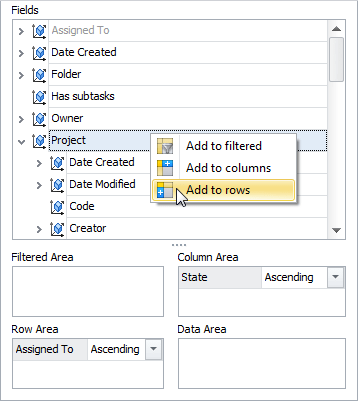
The following fields can be added only to the Data Area box and the Filtered Area box:
- Estimate
- Actual
- Remain
- Deviation
- Number of Tasks
- Completed
Tip Learn how to create a custom OLAP Cube and add custom properties for needed custom entity.
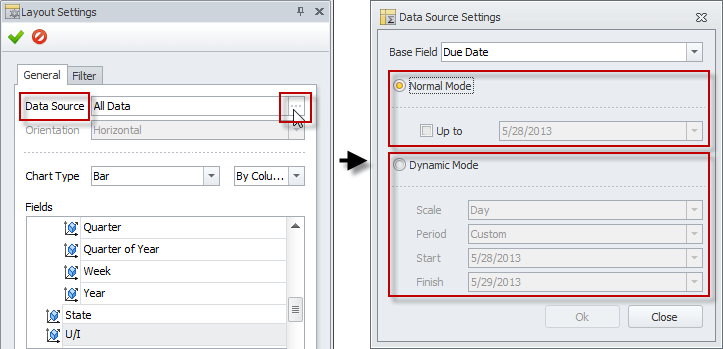
Note Task Analytics view can display data in the Normal mode or the Dynamic mode. The Normal mode, which is set by default, shows either all data or data for a specific date. The Dynamic mode shows data for a particular period in the day, week, month, etc. scale.
- To switch between the modes, click ellipsis in the Data Source box on the Layout Settings pane, and then select required option.
Examples
Progress Tracking
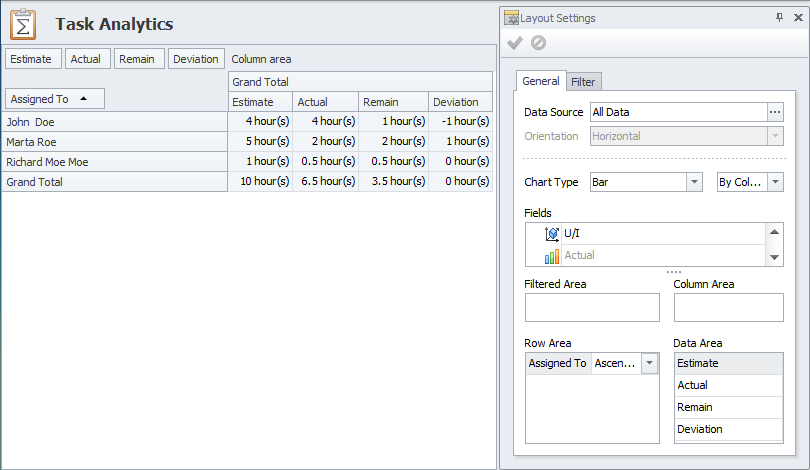
You can track progress of your employees to see if they are behind schedule, on schedule or over schedule.
- Add the Estimate, Actual, Remain, and Deviation fields to the Data Area box.
- Add the Assigned To field to the Row Area box.
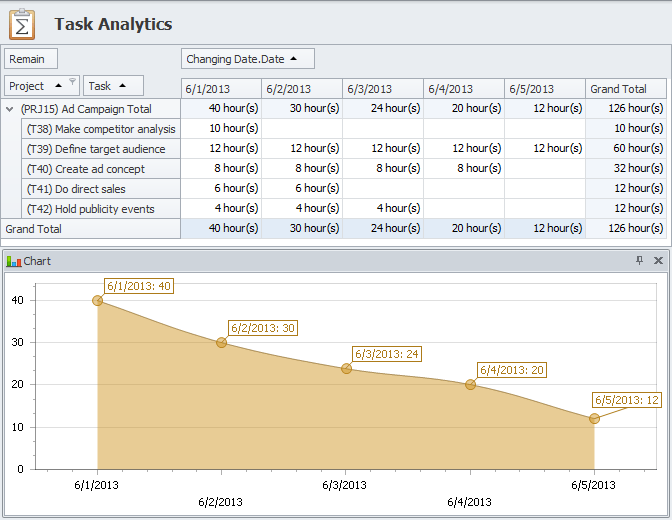
Project Burndown
You can track time left till project completion each day within a particular period.
- In the Layout Settings pane, click ellipsis in the Data Source box, and then in the Data Source Settings dialog box, click Dynamic Mode, and set required Scale and Period.
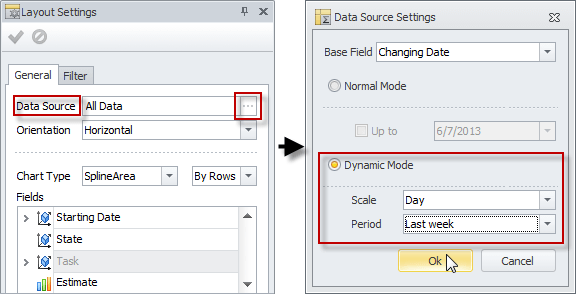
- Add theRemain field to the Data Area box.
- Add the Project and the Task fields to the Row Area box.
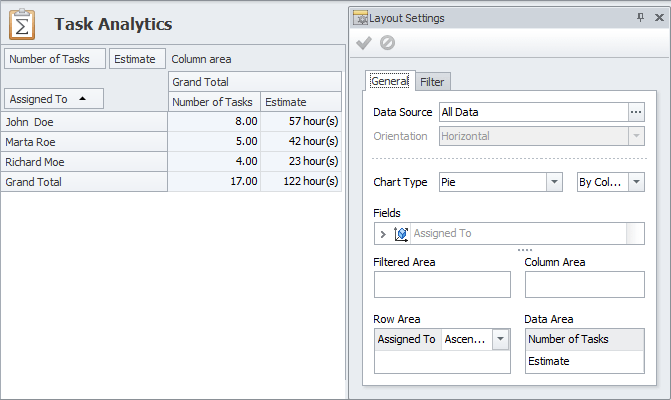
Employee Workload
You can track employee workload to compare how estimated hours are allocated among users.
- Add the Number of Tasks and the Estimate fields to the Data Area box.
- Add the Assigned To field to the Row Area box.
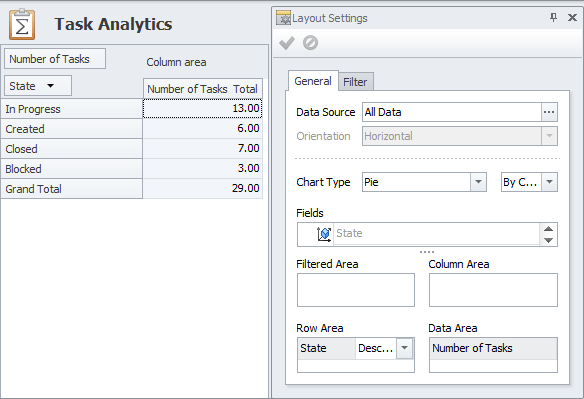
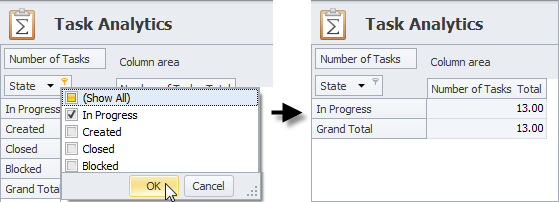
State of Tasks
You can track the state of tasks to see how many tasks are created, in progress, blocked, and closed.
- Add the Number of Tasks field to the Data Area box.
- Add the State field to the Row Area box.
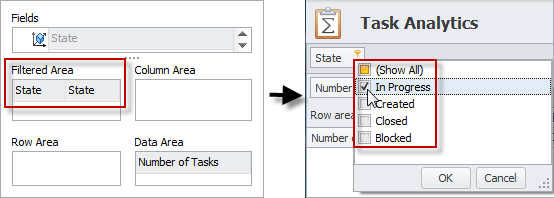
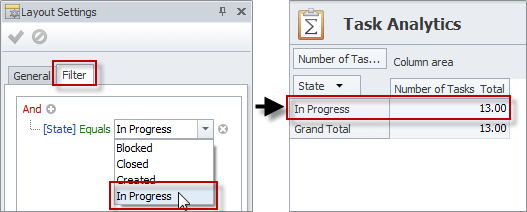
Note You can set Filter by State to show analytics on tasks with particular state in any of the following ways:
- In the Layout Settings pane, click the Filter tab and set required filter condition, ex.: [State] Equals [In Progress].
Tip Learn how to set filters.
- In the State column header, click the Quick Filter icon, and then select the check boxes next to the states you want to show.
- Drag the State field from the Fields list to Filtered Area box, in the State filter header in the upper-left corner of the Task Analytics view, click the Quick Filter icon, and then select the check boxes next to the states you want to show.